
Structural interoperability
Last updated on 2026-10-08 | Edit this page
Estimated time: 60 minutes
Overview
Questions
- What is structural interoperability, and what does it allow software to do?
- How do data models, file formats, schemas, conventions, and access methods differ?
- How can simple tabular formats such as CSV and TSV support reusable, machine-actionable data?
- Which structural standards are appropriate for common climate and atmospheric data types?
- What structural contract does the NetCDF data model provide?
Objectives
By the end of this episode, learners will be able to:
- Explain structural interoperability as a shared, machine-actionable agreement about how data elements are organised and related.
- Distinguish between a data model, encoding or file format, schema, community convention, and access method.
- Evaluate the structural strengths and limitations of CSV/TSV, Parquet, NetCDF, Zarr, GRIB, and GeoTIFF.
- Identify the additional information needed to make tabular data reliably reusable across tools.
- Analyse a NetCDF dataset by identifying its dimensions, coordinate variables, data variables, attributes, and data types.
What is structural interoperability?
Structural interoperability concerns the organisation and representation of data: what kinds of data objects exist, how they are encoded, and how their relationships are expressed. A dataset is structurally interoperable when different software tools can reliably determine how the data are organised and process that organisation without needing undocumented instructions from the person who created it. For example, software may need to determine:
- what records, columns, arrays, variables, or coordinates are present;
- their data types, shapes, and dimensions;
- how different data objects relate to one another;
- which values represent missing data; and
- whether the dataset follows expected structural rules.
A useful guiding question is:
Can another tool determine how the dataset is organised and process that organisation without bespoke instructions from the person who created it?
Structural interoperability does not mean that
software automatically understands the scientific meaning of every
value. For example, a program may recognise that
air_temperature is a floating-point variable organised
across time, latitude, and longitude. Understanding that the variable
represents air temperature, which units apply, or whether it is
scientifically comparable with another temperature variable involves
semantic interoperability. Similarly, being able to
retrieve the dataset from a remote server concerns technical
interoperability. Structural interoperability sits between
these layers: it makes the organisation of the data predictable and
machine-actionable.
Structural interoperability is a shared data contract
A file extension such as .csv, .nc,
.tif, or .zarr tells software something about
how data may be represented, but the extension alone does not make a
dataset structurally interoperable. Structural interoperability depends
on a shared contract about how data are organised. At
the centre of this contract is the data model: the
logical structure that software expects to find.
Choosing a structural representation
Different formats provide different structural contracts.
| Format or standard | Primary data model | Structural strengths | Additional requirement or limitation |
|---|---|---|---|
| CSV / TSV | Rows, columns, cells | Simple, human-readable, broadly supported | Types, missing values, units, dialect, and relationships usually require additional rules or a schema |
| Parquet | Typed, column-oriented tables | Stores a schema and physical types; supports efficient column selection and compression | Scientific meaning, units, coordinate systems, and domain constraints require additional metadata |
| NetCDF | Named multidimensional variables, dimensions, and attributes | Self-describing array structure; variables can share dimensions | Scientific coordinates and variable meaning usually require conventions such as CF |
| Zarr | Chunked, typed N-dimensional arrays and groups | Explicit shape, type, chunk organisation, fill values, and codecs | Scientific coordinate relationships and dimension conventions require additional agreements |
| GRIB2 | Message-oriented meteorological fields | Strict templates and WMO code tables support operational exchange | Highly specialised for meteorological and forecast data |
| GeoTIFF | Georeferenced raster | Combines raster organisation with georeferencing | Scientific metadata beyond raster and georeferencing may require additional conventions |
| COG | GeoTIFF with an access-oriented physical layout | Enables efficient partial retrieval over HTTP | It is a GeoTIFF profile rather than a general scientific metadata model |
| GeoPackage | Geospatial tables, features, rasters, and tiles | Defines tables, constraints, coordinate reference systems, and extension mechanisms | Not designed primarily for large multidimensional climate arrays |
There is therefore no universally “best” structural format.
The choice of data model reflects how you conceptualise the scientific data. Then choose a representation that preserves that structure with the least amount of flattening, reconstruction, or artificial complexity.
| If I think of my data as… | Natural model |
|---|---|
| “a collection of observations” | Tabular |
| “variables varying along several shared dimensions” | Multidimensional arrays |
| “a collection of meteorological forecast fields” | GRIB |
| “a georeferenced spatial surface” | Raster |
| “geographic objects with properties” | Geospatial features |
CSV and TSV: portable, but weakly self-describing
CSV and TSV are widely used because they are simple text formats that can be opened by spreadsheets, databases, statistical software, command-line tools, and most programming languages.
RFC 4180
documents a commonly used CSV syntax and the text/csv media
type.
Consider this small dataset:
station_id,timestamp,air_temperature
NL001,2026-07-13T12:00:00Z,18.4
NL001,2026-07-13T13:00:00Z,18.8
Most software can immediately recognise rows and columns.
However, the file itself may not unambiguously tell a reader:
- which data types the columns contain;
- which unit is used for
air_temperature; - what represents a missing value;
- whether
station_idhas uniqueness constraints; - whether the timestamps are required to use a particular date-time format; or
- whether identifiers refer to records in another table.
Even some properties needed to parse tabular text reliably can vary between files, including delimiters, quote characters, character encodings, decimal marks, and the presence of a header row.
CSV therefore provides excellent syntactic portability, but only a limited structural contract by itself.
That contract becomes stronger when the producer provides explicit rules such as:
- stable column names;
- explicit data types and constraints;
- an unambiguous missing-value policy;
- standard date and time representations;
- stable identifiers and relationships; and
- a machine-readable schema.
Two examples are W3C CSV on the Web and Frictionless Table Schema.
TSV follows the same tabular model but uses tabs rather than commas as delimiters.
The important point is therefore not that CSV is “non-interoperable.”
CSV is highly exchangeable, but weakly typed and weakly self-describing.
A carefully structured CSV accompanied by a machine-readable schema can be more interoperable than a poorly organised dataset stored in a more sophisticated binary format.
Which structural contract is missing? — Think, Pair, Discuss
For each case, identify:
- what a general-purpose software tool can already determine; and
- what additional structural information would improve interoperability.
Case 1
rainfall.csv contains:
station,date,valueCase 2
radar.h5 contains several groups and arrays but follows
no published schema or community convention.
Case 3
temperature.nc contains dimensions, variables, and
attributes but does not declare a metadata convention.
Case 4
satellite.tif contains image pixels but no coordinate
reference system or geotransform.
Case 5
forecast.zarr contains chunked arrays with known shapes
and data types, but the relationships among those arrays are not
documented.
1. rainfall.csv
Software can recognise rows and columns.
Additional information could specify data types, date representation, units, missing values, identifier constraints, and relationships with other tables. A CSVW or Frictionless schema could provide much of this information.
2. radar.h5
An HDF5 reader can inspect groups, datasets, shapes, data types, and stored attributes.
However, HDF5 permits many possible organisational structures. Without a shared schema or convention, software cannot assume what the groups and arrays represent or how they relate.
3. temperature.nc
A NetCDF reader can determine variables, dimensions, shapes, types, and attributes.
Additional conventions may still be necessary to identify coordinates, standard scientific quantities, units, grid mappings, and other domain-specific relationships consistently. In climate science, CF Conventions commonly provide these rules.
4. satellite.tif
An image reader can decode the pixel grid.
Without georeferencing information, however, geospatial software cannot determine where that grid belongs on Earth. GeoTIFF provides standard mechanisms for encoding coordinate reference and spatial transformation information.
5. forecast.zarr
A Zarr implementation can find arrays, decode chunks, and determine shapes and data types.
Additional conventions are still needed to identify shared dimensions, coordinate arrays, scientific variables, units, and grid mappings consistently.
NetCDF: a shared data model for multidimensional scientific data
NetCDF — Network Common Data Form — is designed for storing and exchanging array-oriented scientific data. Its importance for structural interoperability comes from its shared data model. Rather than allowing every dataset creator to invent an arbitrary internal organisation, NetCDF defines a set of structural objects that software can inspect consistently. This allows different software tools to recognise how multidimensional data are organised without requiring dataset-specific instructions.
NetCDF was born from an interoperability problem
NetCDF originated at Unidata, part of the University Corporation for Atmospheric Research (UCAR) in the United States, at the end of the 1980s. The motivation was practical: Unidata needed a common way for different applications and computer systems to access and exchange real-time meteorological data. In 1987, Unidata organised a workshop to explore ideas from NASA’s Common Data Format (CDF). Building on these ideas, Glenn Davis and Russ Rew developed the first versions of NetCDF, with the format coming into use around 1989. The original goal was therefore not simply to invent another file format. NetCDF was designed to provide a portable, self-describing interface for array-oriented scientific data, allowing the same data to be accessed by different software, programming languages, and computer systems.
NetCDF was born from an interoperability question: how can scientists store multidimensional data once and allow different tools and computers to understand its structure?
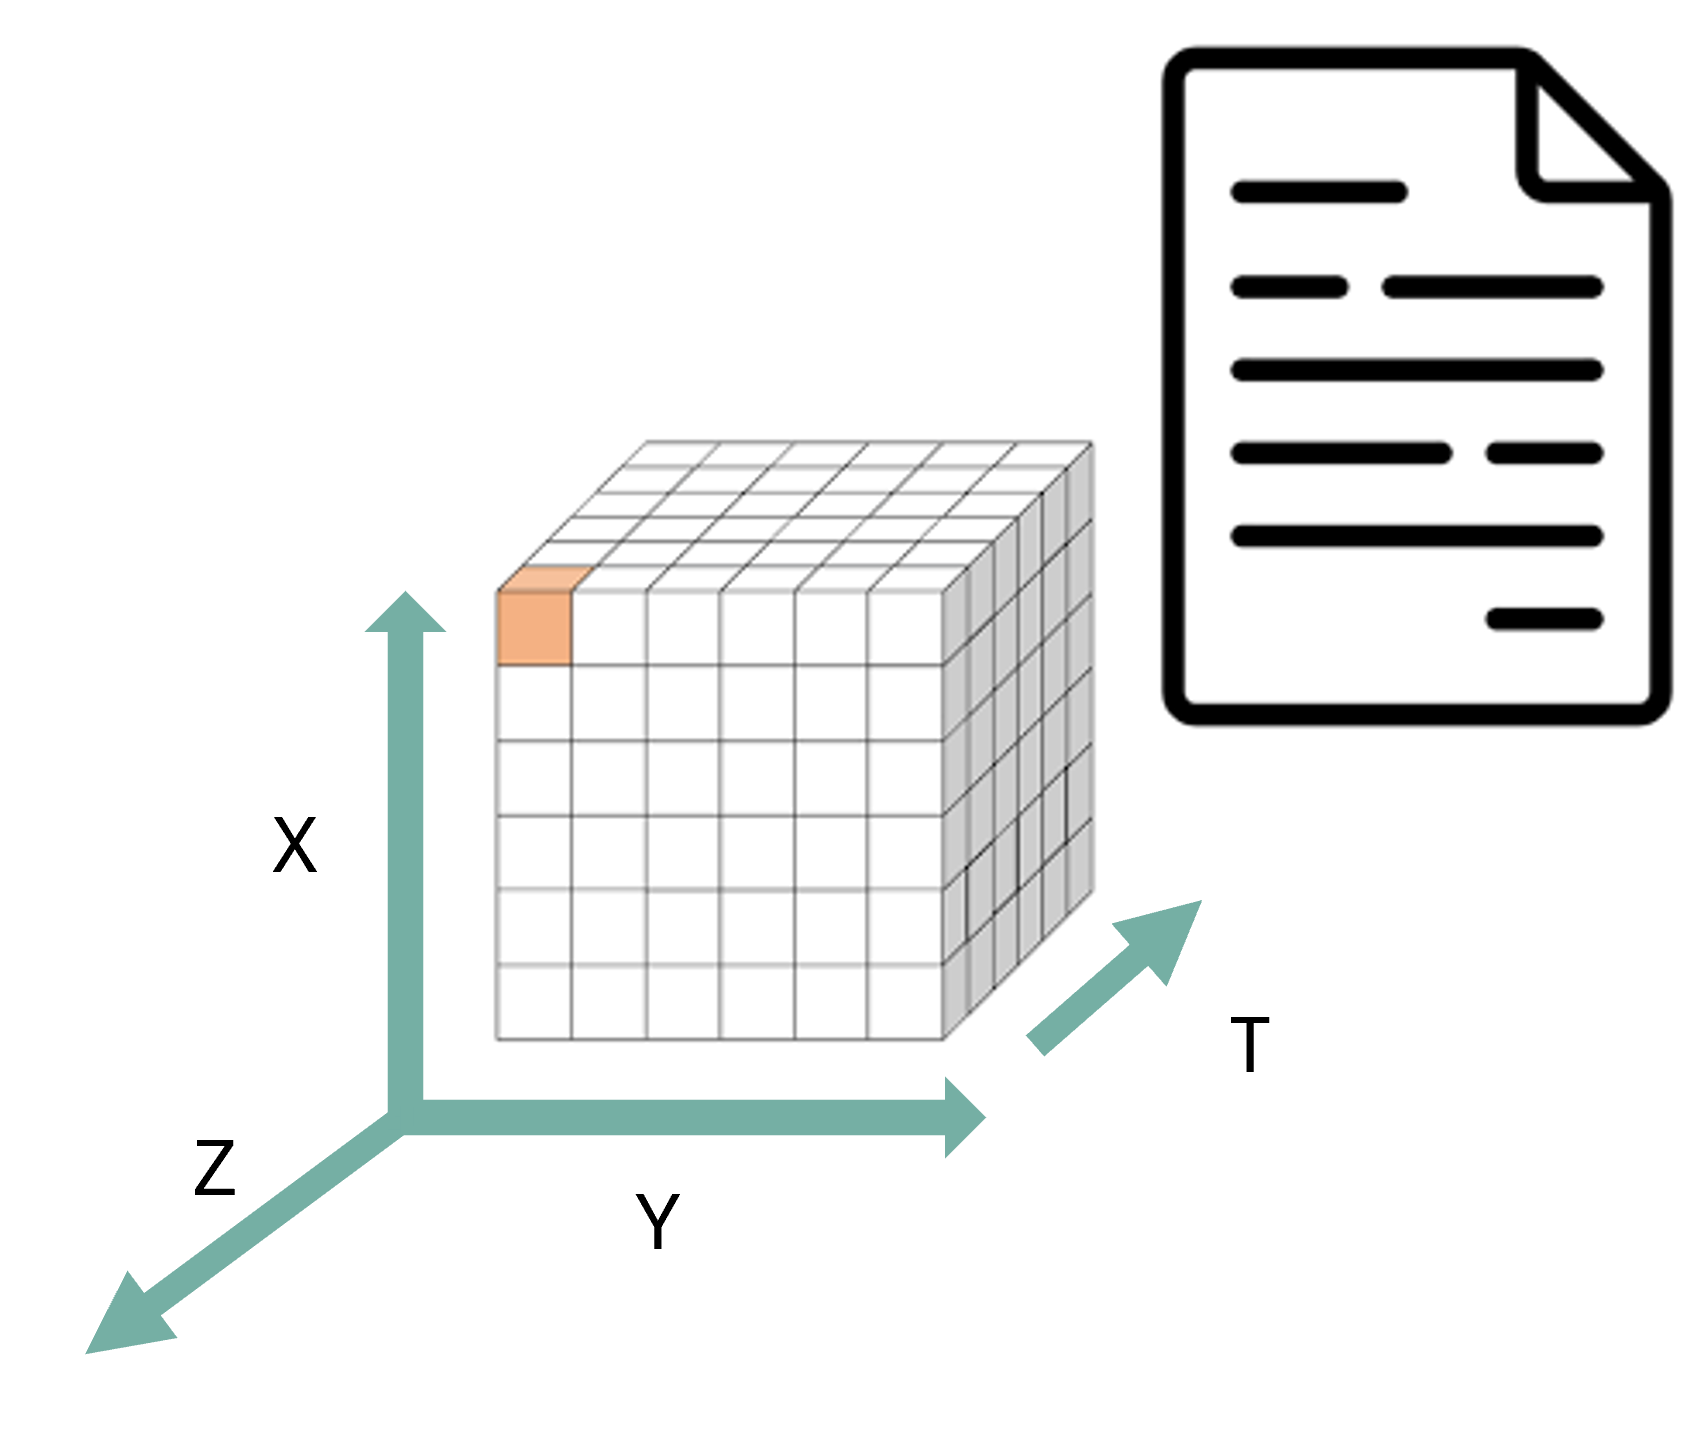
The classic NetCDF data model answers this question using three central structural elements: dimensions, variables, and attributes.
Dimensions
Dimensions define named axes and their lengths.
For example:
time = 24
latitude = 180
longitude = 360
Dimensions describe the shape of the dataset and allow different variables to refer to the same axes.
For example, both temperature and pressure measurements may vary over
the same time, latitude, and
longitude dimensions.
Variables
Variables are typed N-dimensional arrays whose shapes are defined using dimensions.
For example:
float air_temperature(time, latitude, longitude)This declaration tells software that
air_temperature:
- contains floating-point values;
- has three dimensions; and
- is organised along the shared axes
time,latitude, andlongitude.
Another variable can reuse the same dimensions:
float surface_pressure(time, latitude, longitude)The two variables are therefore structurally related through their shared dimensions. Software does not need to infer this relationship from where the values happen to occur in the file: the relationship is explicitly represented by the NetCDF data model.
Attributes
Attributes store metadata associated either with individual variables or with the dataset as a whole.
For example, variable-level attributes might include:
air_temperature:units = "K"
air_temperature:_FillValue = -999.0
A global attribute can describe the dataset itself:
title = "Atmospheric observations"Attributes therefore provide additional information about variables or about the dataset without changing the dimensional structure of the arrays. The enhanced NetCDF-4 data model additionally supports groups, additional data types, multiple unlimited dimensions, and user-defined types.
What software can determine from NetCDF
Because dimensions, variables, and attributes follow the NetCDF data model, a NetCDF reader can programmatically inspect:
- dimension names and lengths;
- variable names, data types, and shapes;
- which dimensions are shared between variables;
- variable-level and global attributes;
- fill values and storage encodings; and
- in NetCDF-4, groups and chunking information.
Consider again:
float air_temperature(time, latitude, longitude)A NetCDF-aware tool can determine that air_temperature
is a three-dimensional floating-point array and that its values are
organised according to the dimensions time,
latitude, and longitude. This is what makes
NetCDF self-describing at the structural level.
The structure required to read the dataset is stored with the data rather than depending entirely on an external README or instructions from the researcher who created it.
What NetCDF does not guarantee
Being a valid NetCDF dataset does not guarantee that every climate-science application will interpret its scientific content consistently. NetCDF defines how dimensions, variables, data types, and attributes can be represented, but it does not by itself require communities to use the same:
- coordinate rules;
- variable names;
- scientific units;
- grid descriptions;
- missing-value practices; or
- terminology for physical quantities.
For example, all of the following could be syntactically valid NetCDF variable names:
temp
temperature
air_temp
T
NetCDF can tell software that these are variables and describe their data types, dimensions, and attributes. However, the NetCDF data model alone does not guarantee that software will understand that they represent the same physical quantity.
For climate and atmospheric data, the Climate and Forecast Metadata Conventions provide additional community rules for describing coordinates, scientific variables, units, grid mappings, cell bounds, and other metadata.
This gives us an important distinction: NetCDF provides a shared multidimensional data model; CF provides a more specific community contract for using that model consistently.
Inspecting the structure of a real NetCDF dataset
We can now apply these concepts to an atmospheric radar dataset.
The IDRA dataset is exposed through OPeNDAP, which allows us to inspect its NetCDF structure remotely.
Identify the structural elements in a NetCDF dataset
Open the OPeNDAP inspection page for the IDRA dataset:
Identify:
- the global attributes;
- the dimensions and their lengths;
- the coordinate variables;
- three data variables and their dimensions;
- the data types of those variables;
- one variable-level attribute that controls the representation of missing data; and
- any variables that appear to contain descriptive metadata as data values rather than as global attributes.
1. Global attributes
The dataset-level attributes include:
title
institution
history
references
Conventions
location
source
example
The Conventions attribute declares:
CF-1.4This declaration indicates that the producer intends the dataset to follow CF version 1.4.
The declaration itself does not demonstrate conformance; that requires checking the file against the convention.
2. Dimensions
The OPeNDAP Data Descriptor Structure shows:
time_raw_data = 73728
sample_beat_signal = 1024
time_processed_data = 144
range = 512
scalar = 1
3. Coordinate variables
Variables whose names match their corresponding dimensions include:
time_raw_data(time_raw_data)
sample_beat_signal(sample_beat_signal)
time_processed_data(time_processed_data)
range(range)
The scalar dimension does not have a variable named
scalar. It is used as a length-one dimension by several
variables.
4. Example data variables and dimensions
Examples include:
i_hh(time_raw_data, sample_beat_signal)

noise_power_horizontal(range)

equivalent_reflectivity_factor(time_processed_data, range)

radial_velocity(time_processed_data, range)

azimuth_processed_data(time_processed_data)
The variable declarations therefore expose how each variable relates to the dataset’s dimensions.
5. Example data types
Examples include:
i_hh                          16-bit integer

time_processed_data           64-bit real number

equivalent_reflectivity_factor
                              32-bit real number

range                         32-bit integer
6. Missing-data representation
Several processed radar variables, including
equivalent_reflectivity_factor,
differential_reflectivity, radial_velocity,
and spectrum_width, declare:
_FillValue: -999.0The existence, location, and type of _FillValue are part
of the dataset’s structural representation.
What should happen analytically to a missing observation — for example whether it should be excluded or interpolated — is a separate analytical decision.
The file is structurally inspectable because software can discover named dimensions, typed variables, shared axes, and attached attributes without bespoke instructions.
Whether every scientific variable and coordinate is described consistently according to CF is a different question. That takes us from structural interoperability towards semantic interoperability.
Can Ash compare two radar datasets from different years?
Ash wants to compare two IDRA radar datasets:
Both datasets are stored as NetCDF and exposed through OPeNDAP.
That already tells Ash two useful things:
- the same family of software can inspect their NetCDF structures; and
- the same access protocol can retrieve them.
But it does not prove that the datasets can simply be combined.
Ash still needs to compare properties such as:
variable names and data types
dimensions and dimension order
coordinate variables and coordinate values
fill values and missing-data representations
units and scaling attributes
declared conventions
variables present or absent in each dataset
This highlights three different interoperability questions:
| Question | Interoperability layer |
|---|---|
| Can the same software and protocol retrieve the datasets? | Technical interoperability |
| Are the arrays, dimensions, coordinates, types, and metadata organised according to compatible rules? | Structural interoperability |
| Do the variables represent scientifically comparable quantities using compatible definitions and units? | Semantic interoperability |
Structural interoperability reduces the amount of dataset-specific code required to compare the files. It does not remove the need to determine whether their scientific contents are genuinely comparable.
- Structural interoperability is a shared, machine-actionable contract about how data objects are organised, typed, related, and represented.
- A file extension alone does not provide that contract: data models, encodings, schemas, and community conventions play different roles.
- The appropriate representation depends on the underlying data model; tables, multidimensional arrays, meteorological fields, and rasters have different structural requirements.
- CSV and TSV are highly portable but weakly self-describing; schemas and explicit structural rules make them more predictable for software.
- NetCDF provides a shared multidimensional array data model based on dimensions, variables, and attributes.
- NetCDF makes dataset structure machine-actionable, while conventions such as CF add community rules needed for consistent scientific interpretation.
- Structural interoperability does not by itself guarantee semantic compatibility or technical accessibility.